Light pollution
People often say that my skies must be very good when looking at my images. As you can see from the above slideshow, I certainly have a decent 360 degree view, but how good are my skies? There is an excellent resource for Sky readings here - This is the official Unihedron site that makes the SQM-L sky quality meters.
What is Light Pollution?
A simple dictionary definition is that light pollution is the brightening of the night sky caused by street lights and other man-made sources, which has a disruptive effect on natural cycles and inhibits the observation of stars and planets.
You can see this if you live near a town or city - Look towards it and you can see a sky glow - This is a form of light pollution. If you live in a place with many lights you will see much less of the night sky than if there was no lights. Even the moon on a clear night causes light pollution for astro imagers!
You can see this if you live near a town or city - Look towards it and you can see a sky glow - This is a form of light pollution. If you live in a place with many lights you will see much less of the night sky than if there was no lights. Even the moon on a clear night causes light pollution for astro imagers!
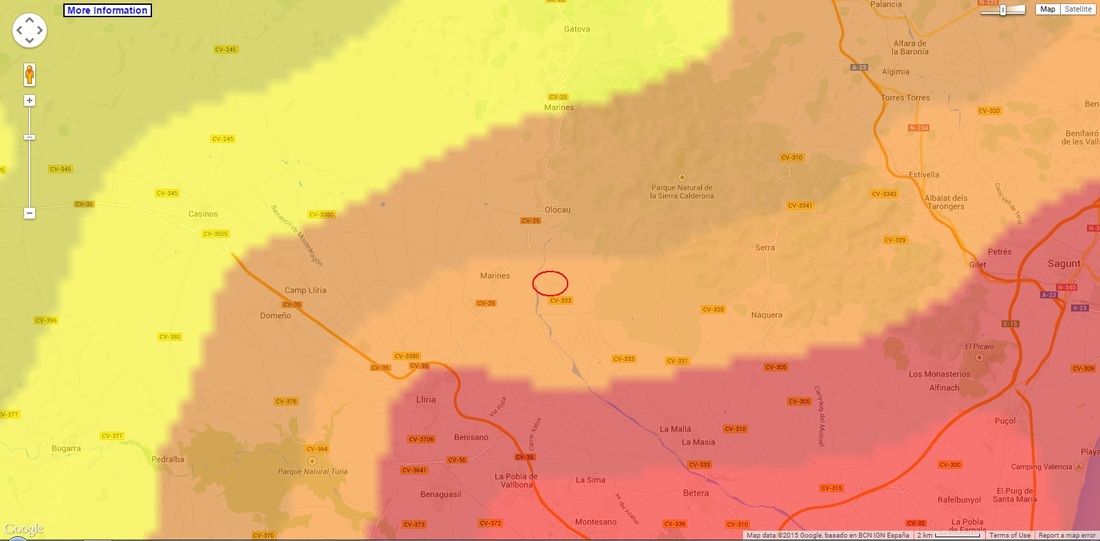
Here is a close up of my area showing a light pollution map overlaid on Google maps. This is taken from 2006. I have circled the area of my observatory.
|
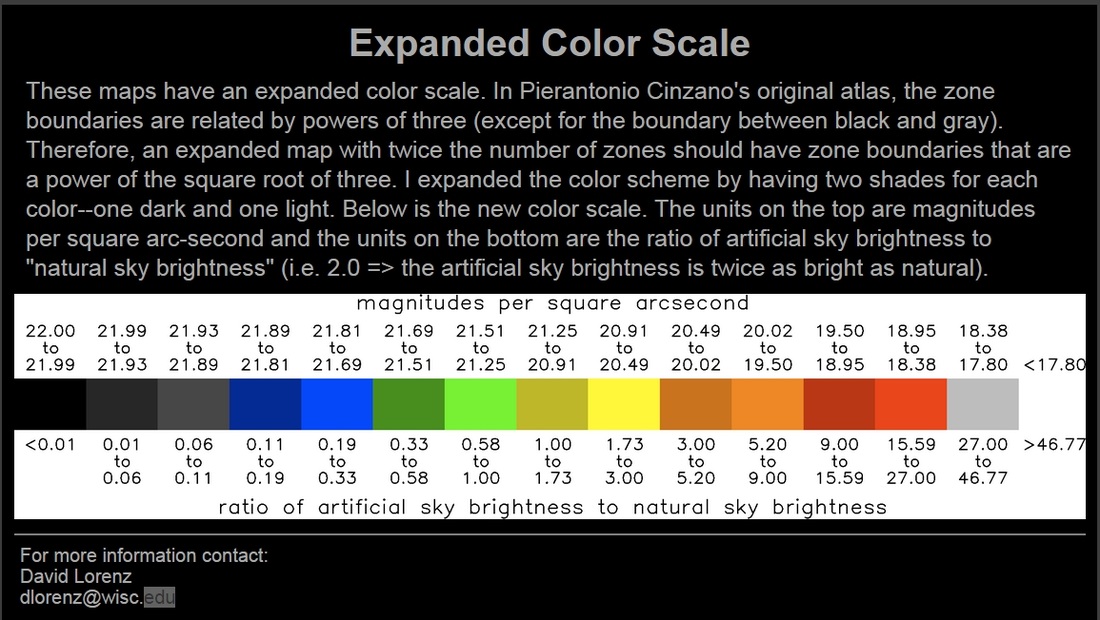
As you can see, my observatory is based within an orange zone, that according to the colour scale is equivalent to 20.02 to 19.50 magnitude.
I have tested this with a SQM-L sky quality meter and the best reading I have got is 20.30. So in reality a little better than the map suggests. As you can see, my views to the south are poor as I am imaging towards Valencia, Spain's third largest city. |
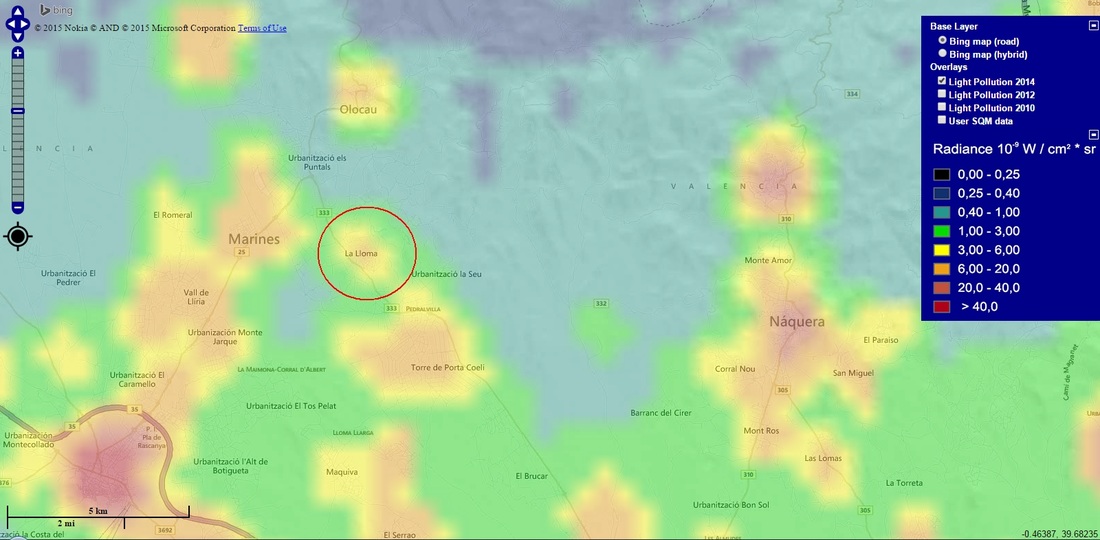
Here is another Light Pollution Map with data courtesy of the Earth Observation Group (EOG) - I think this is probably a more accuate representation of my local light pollution as the Sierra Calderona National park to my East is light free.
If you want to check out your own light pollution map you can do so using the following links.
Light Pollution Atlas 2006 - Thanks to David Lorenz from the University of Wisconsin for compiling this excellent data
Light Pollution Map 2014 - With this map you can pick which overlay you would like - This is taken from the official SQM-L website and includes actual SQM-L readings where applicable
You can see a 2013 Light pollution snap shot here
If you want to submit your own Light meter reading then you can do so here
Astro darkness
While not directly related to light pollution, Astro darkness is something that is very relevant to imaging. You have probably heard of the fact that in the North they have a period over the summer where the sun never sets. As you move further south towards the equator you get a more balanced night and day - By that I mean half and half.
Here in Spain, I do have sufficient astro darkness to be able to image all year round - In the summer months I get a few hours of astronomical darkness, where the sky is sufficiently dark to image. This is demonstrated in the diagram below.
Here in Spain, I do have sufficient astro darkness to be able to image all year round - In the summer months I get a few hours of astronomical darkness, where the sky is sufficiently dark to image. This is demonstrated in the diagram below.


