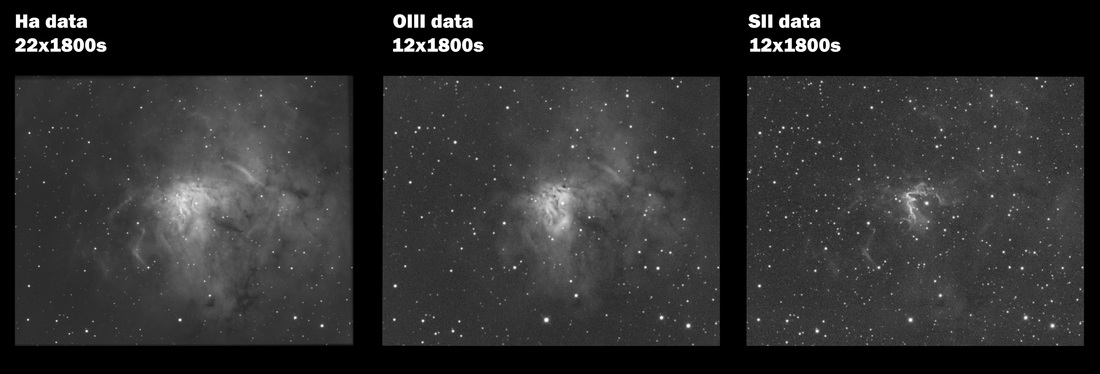
The difference in data in narrowband imaging
Narrowband imaging is classed as using filters that only allow a very narrow band width of light through them. Traditionally the filters used are
The light wavelengths that these filters allow to pass are as follows
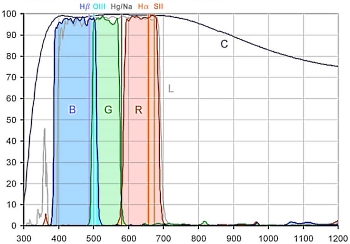
This can be demonstrated by the following diagram of part of the light spectrum - This shows the Ha, OIII and SII bandwidths.
- Ha (Hydrogen Alpha)
- OIII (Oxygen III)
- SII (Sulphur II)
The light wavelengths that these filters allow to pass are as follows
- OIII 501nm
- Ha 656nm
- SII 672nm
This can be demonstrated by the following diagram of part of the light spectrum - This shows the Ha, OIII and SII bandwidths.
This can be compared to the normal RGB filters (diagram below) where the bandwidths are very different. From this image you can see the bandwidths of light filtered by the more usual Red, Green and Blue filters.
- Blue 400-500nm
- Green 500-600nm
- Red 600-700nm
RGB filters are often called broadband filters, due to the large amount of light they pick up, whereas the narrowband filters will allow a much smaller range of light through them.
Narrowband filter data is generally combined in processing to the following colours
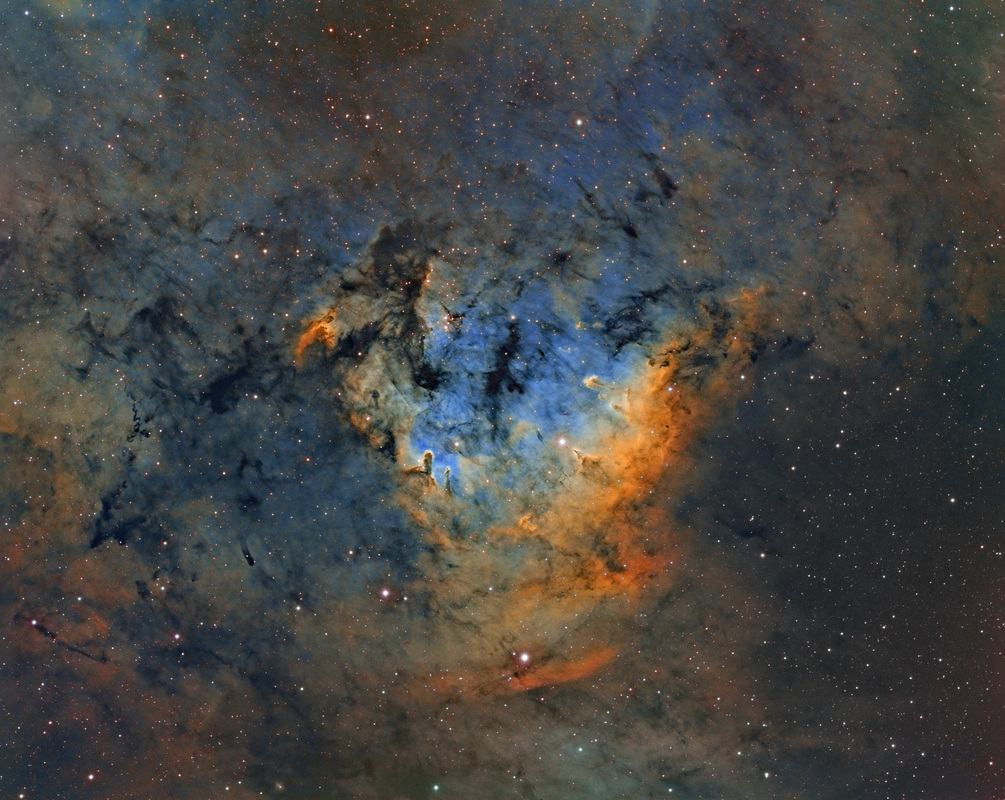
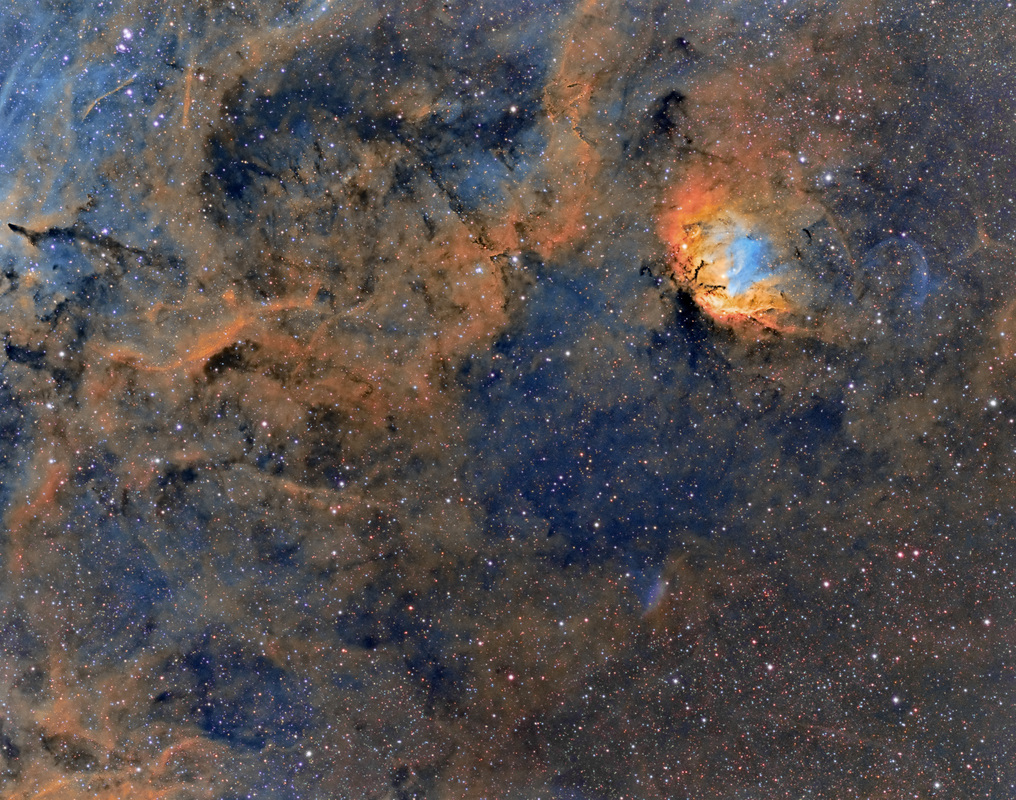
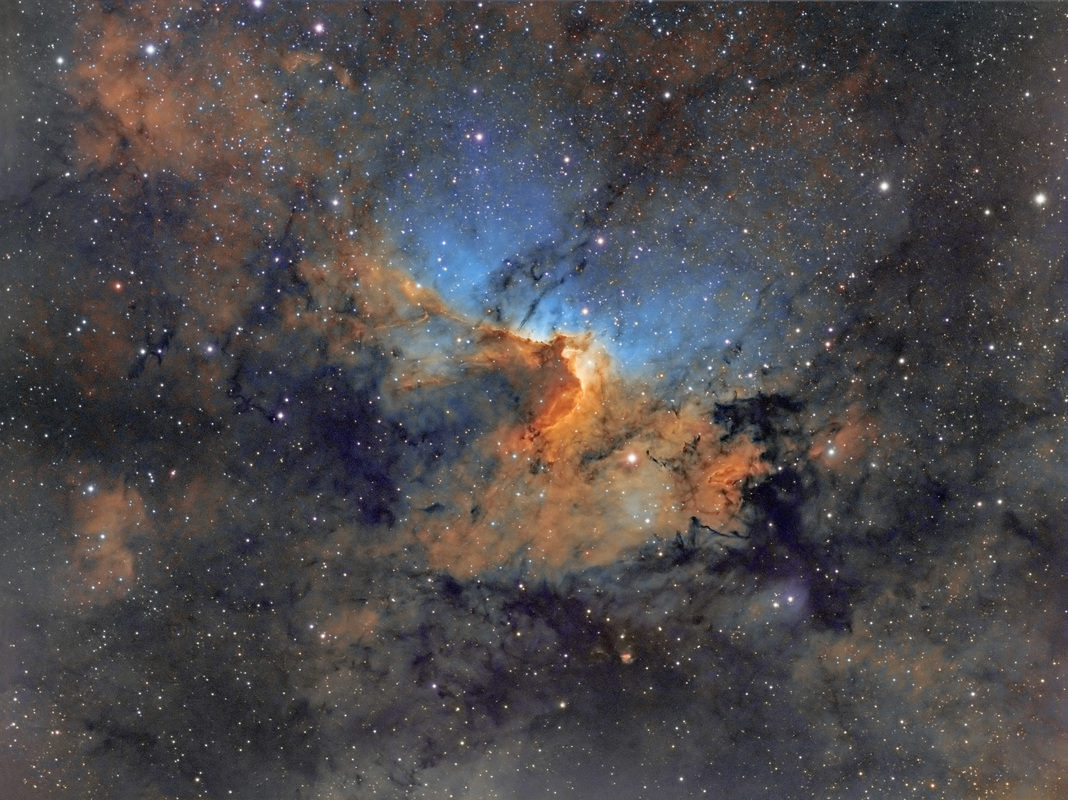
This will produce the more traditional HST (Hubble Space Telescope) palette, such as the images below. Each of these contain Ha, OIII and SII data.
- Ha - Green
- OIII - Blue
- SII - Red
This will produce the more traditional HST (Hubble Space Telescope) palette, such as the images below. Each of these contain Ha, OIII and SII data.
What I think is interesting to be able to show, is the difference in data collected by the different filters. My camera is mono and so colour is added in the processing stage, when I assign the specific filters to the RGB channels as listed above.
It is due to the different data that is captured through each filter that you get details in different colours.
Here is the narrowband data for NGC1491. This is Ha, OIII and SII data taken through 3nm Astrodon filters. Here you can see that you really do get different structure and detail coming through in each filter.
Here you can see the difference between the different filters. Ha tends to pick up the general emission nebula, whereas OIII and certainly SII are more specific in the data that they actually capture. With SII here it's possible to see that it picks up only certain parts and doesn't tend to add to the emission nebula clouds and nebulosity.

